3/7/18 Storm Update- March Coming in Like a Lion
Sorry I’m late on this, but work has been keeping me busy:
I really thought that I had made my last post about a snowstorm for the season, but unfortunately it’s looking like I was wrong. As of this afternoon, models are starting to come to some consensus in terms of total snowfall. However, the forecast is not locked in yet. At this point the region is looking at anywhere from 3-12″+ of snow by the end of the storm on Wednesday night. There are a few things that make this forecast particularly difficult: Temperatures throughout the storm will remain at or just above freezing, the start time of the storm will heavily impact totals since daytime snow in March tends to compact quicker due to the warmer/higher sun angle, and finally how quickly/when does any potential rain/sleet change over to snow.
The snow will begin sometime just before sunrise on Wednesday and continue throughout the day, models are showing signs of some very heavy snow bands during the day. However, we may not know where that banding will set up until tomorrow evening. Areas that get into this banding will see snow rates for 2-3″ per hour. The snow will begin to wind down by Wednesday evening. Overall, this will be an impactful event for our region on Wednesday and cause a nightmare of an afternoon commute.
For now my thoughts are as follows for snow totals:
Nassau and Queens: 4-8″ with a potential for a foot
Western Queens, Brooklyn, Manhattan: 5-10″, but it may not look like it due to the factors mentioned above plus the Urban Heat Island effect
Western Suffolk: 3-6″
Eastern Suffolk: 2-5″
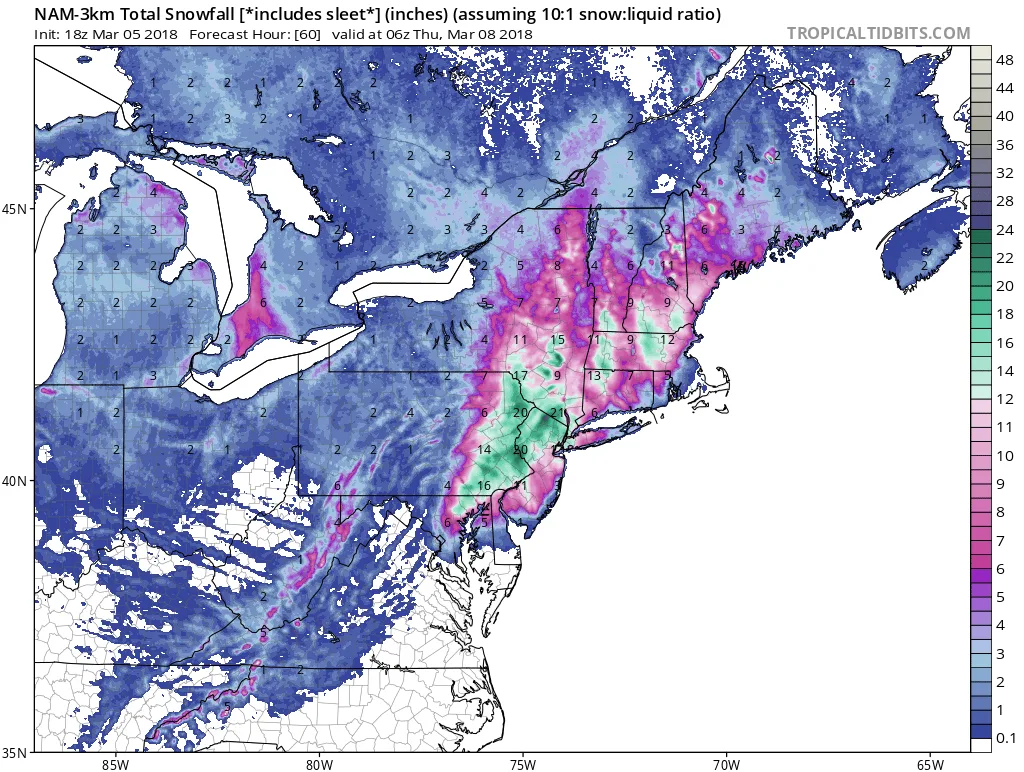
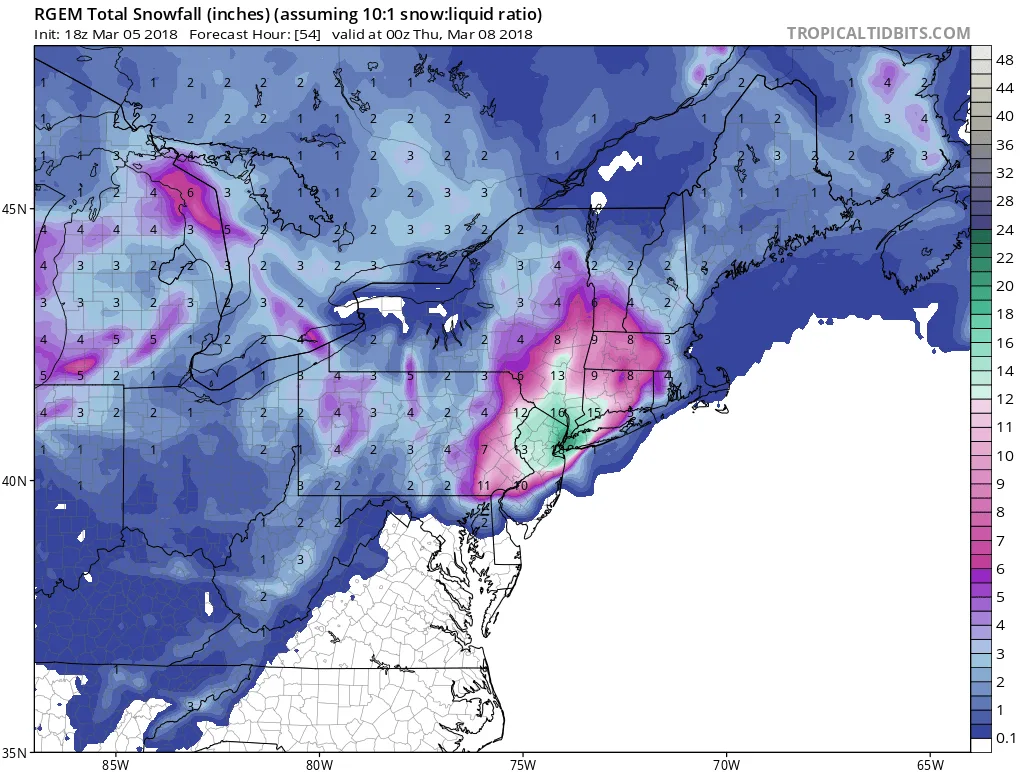
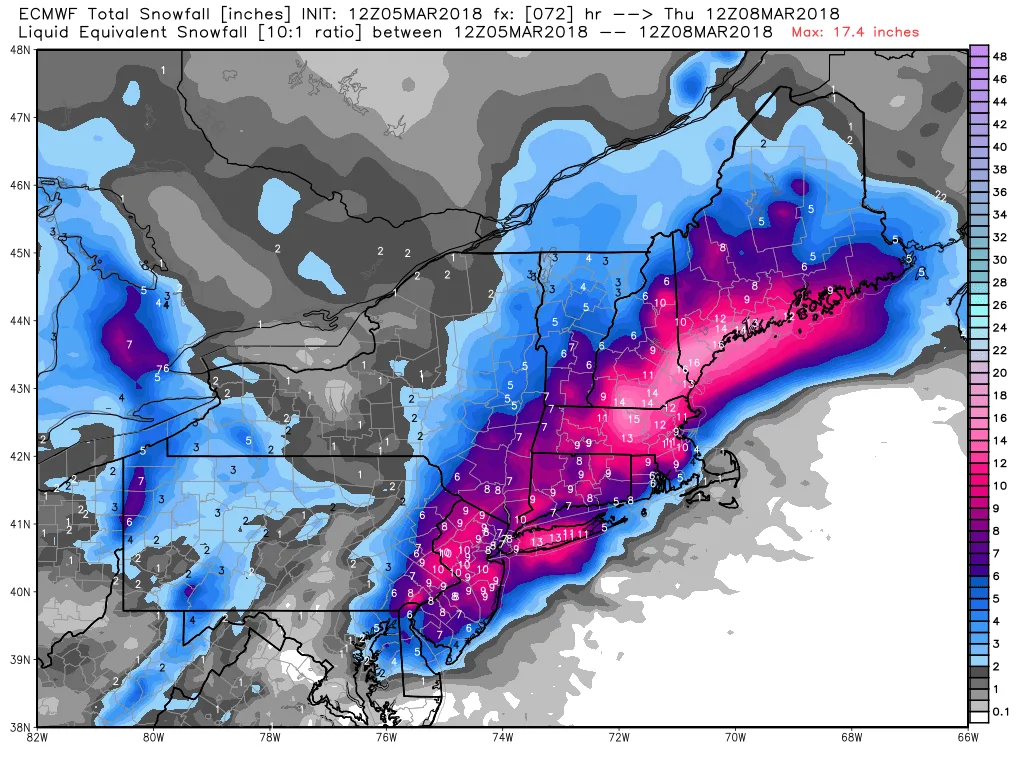
And finally for those who enjoy snow maps here is some eye-candy for you. Just keep in mind that these don’t take into account any melting or compaction that will take place during the storm: