About me
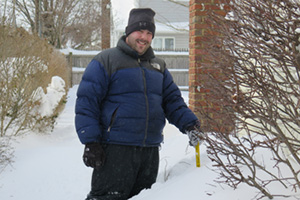
I'm a weather hobbyist who has been hooked on the weather since I was a young boy. Way back when, I even asked for a Doppler radar for my birthday. That turned out to be impossible (and illegal). Thanks, Mom, for actually going to News 12 and asking.
Read the rest
I started this blog in 2016 because friends and family kept turning to me whenever the TV weathermen got into a panic over the next storm. Writing it up here was an easier way to share what I was seeing with everyone at once. It has always been an in-my-backyard blog: Long Island and New York City, written from right here on Long Island.
A lot has changed since then. Tracey and I now have three kids, there have been new jobs, and life got busy. The posts got fewer and further between, but the hobby never went away.
This version of the site is a reinvention. A new generation of AI tools has let me build what I always wanted: a site that pulls in the computer models and the National Weather Service, tracks how each one has done, and helps me analyze the data and make my own call. When a storm is coming, you'll still hear from me.
And a special thank you to Tracey, who still puts up with my weather-nerd side and with me disappearing into my devices whenever a big storm is on the way.
Alex
About this site
I read the models and the National Weather Service, then make my own call. This isn't an official forecast.
This is my working forecast for New York City, Long Island and Westchester. I write a morning update and an evening outlook, and I add a note whenever something changes.
Between my updates, this page keeps refreshing from the latest computer models. Anything marked Automatic update or Automatic summary was put together by a computer from those numbers, not written by me.
For official warnings, watches and advisories, go to the National Weather Service in New York: weather.gov/okx.
How the forecast is made
-
The models
I blend eight computer models, and none of them gets the final say. You can see all of them side by side on the Models page. The Snow view adds up each model's snow, with the National Weather Service's total beside it. The Ice view marks the hours a model shows freezing rain or drizzle, because the models don't give an ice amount, and shows the National Weather Service's ice total. Snow amounts on every page, the Maps page included, count 10 inches of snow for each 1 inch of water (10:1). The one exception is NBM, NOAA's blend of many models: it works out its own snow amount, so I use its number as it comes.
-
The blend
I scored each model against the actual highs and lows at Republic Airport in Farmingdale, one day ahead, two days ahead and so on. Each model counts more on the days it has done best here. No single model has been clearly best, so the weights are spread fairly evenly. The HRRR counts only for the next 18 hours, and the European AI model counts more the further out you go.
For rain I use a weighted middle of the models, so one very wet model can't decide the forecast. The range I show is still the full spread of the models, so you can see when they disagree.
-
Fixing each model's habits
If a model has been running a few degrees too warm or too cool here, I nudge its numbers back before blending (). I need at least two weeks of its forecasts to tell. I do the same for gusts and wind. Around Farmingdale those start from a study of past forecasts, so they're corrected from day one.
-
My call
This is where I make my own call. I look at the blend next to the National Weather Service's forecast, then write the morning update and the evening outlook. The "What to watch" box is where I flag anything worth planning around.
Where each number comes from
- The current temperature: the weather station nearest you, from the National Weather Service's observations (Farmingdale, for example).
- Each day's high, low, rain and gusts: my blend of the models.
- The NWS part of each day, and the note showing whether my blend is above or below the NWS: the National Weather Service.
- Text marked "From Alex": me.
- Text marked "Automatic": a computer summary of the blend.
Glossary
- My blend
- My forecast number: a weighted average of eight weather models, with more weight on the ones that have done best at Farmingdale.
- Agreement
- How close the models are to each other. Close together means more confidence; far apart means the forecast could still change.
- Confidence
- How sure I am about a call, from one dot (could easily change) to three (confident).
- Bias-corrected
- Each model's recent habit, like running 2° too warm, is measured against what Farmingdale recorded and taken out before blending. It starts after two weeks of scored days.
- Chance of rain
- From about 80 versions of the American and European models, each run with small tweaks. 7 in 10 means 7 of every 10 versions bring at least 0.04 in that day.
How we've done
Data sources
- Hourly model forecasts: Open-Meteo (CC BY 4.0).
- Rain totals: airport gauges (National Weather Service) checked against nearby rain gauges from CoCoRaHS (CC BY 4.0) and the Citizen Weather Observer Program, through NOAA MADIS.
- NOAA/NCEP models: HRRR, RRFS, GFS, NBM and AIGFS. (The NAM was retired by NOAA on November 3, 2026; RRFS replaced it.)
- ECMWF models: IFS and AIFS (CC BY 4.0).
- Environment and Climate Change Canada: HRDPS.
- National Weather Service: forecasts, current conditions, watches, warnings and advisories (US government data, public domain).
Times are Eastern.