Pi Day Storm- 3/13/2017 Mid-Morning Update
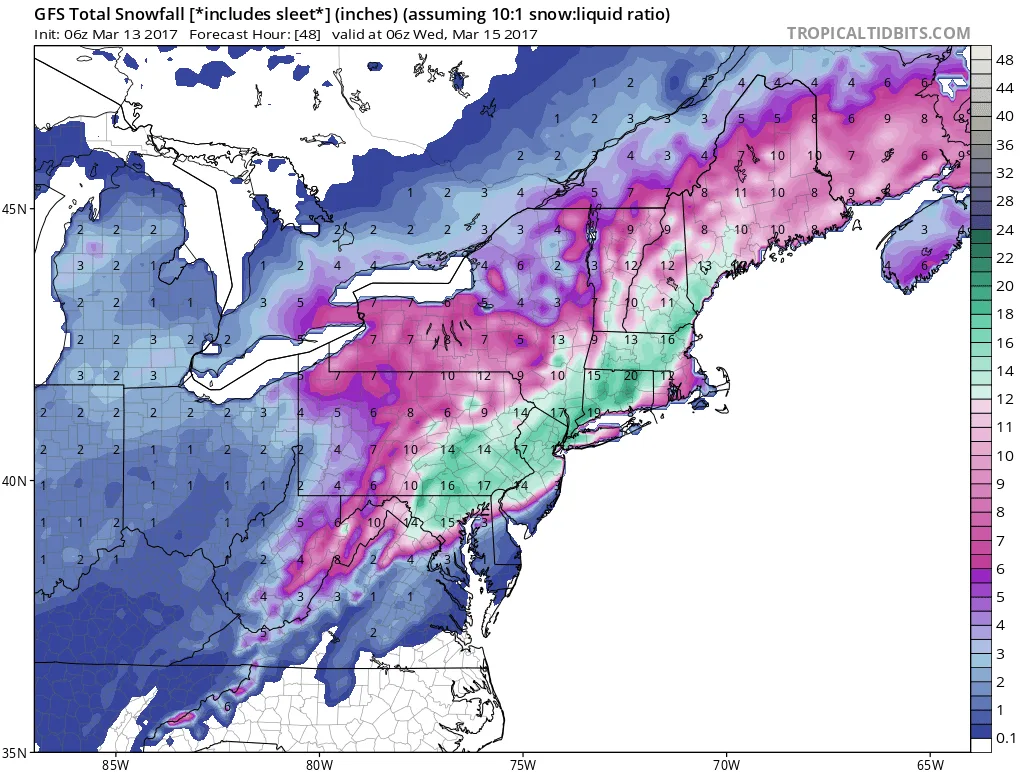
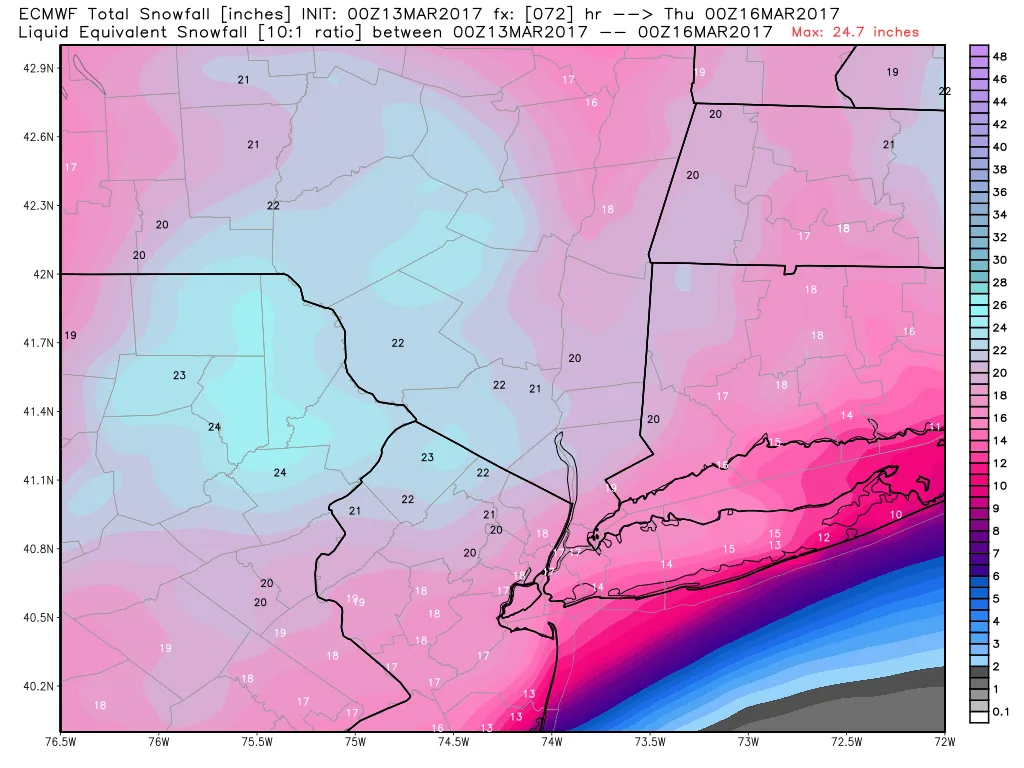
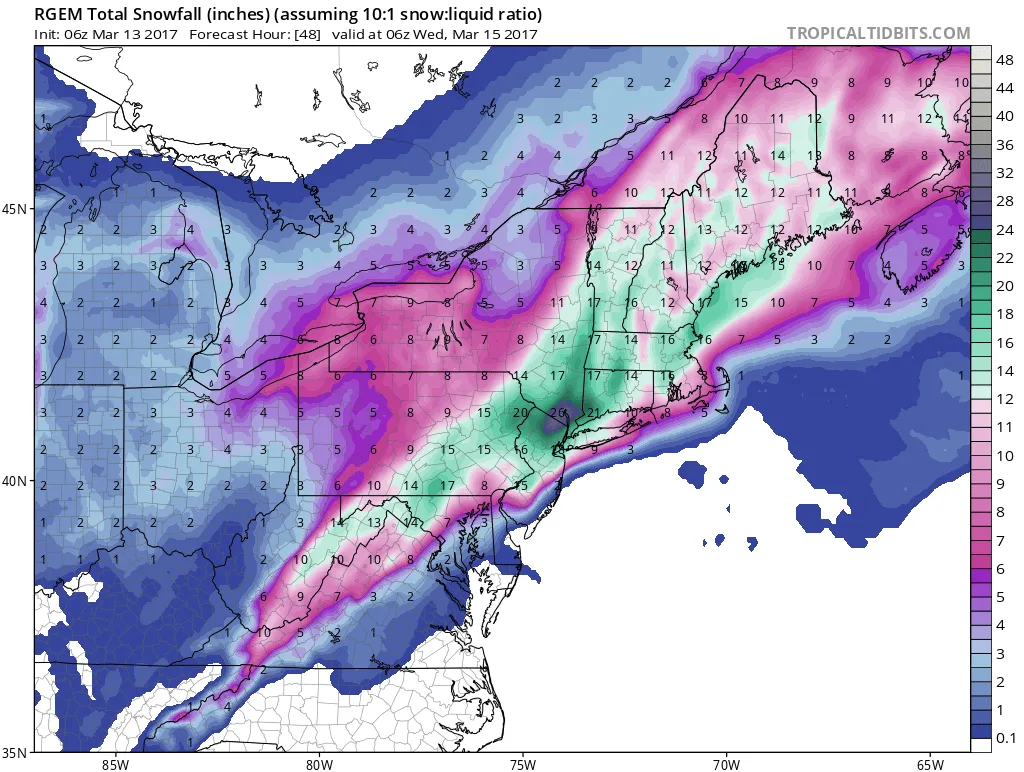
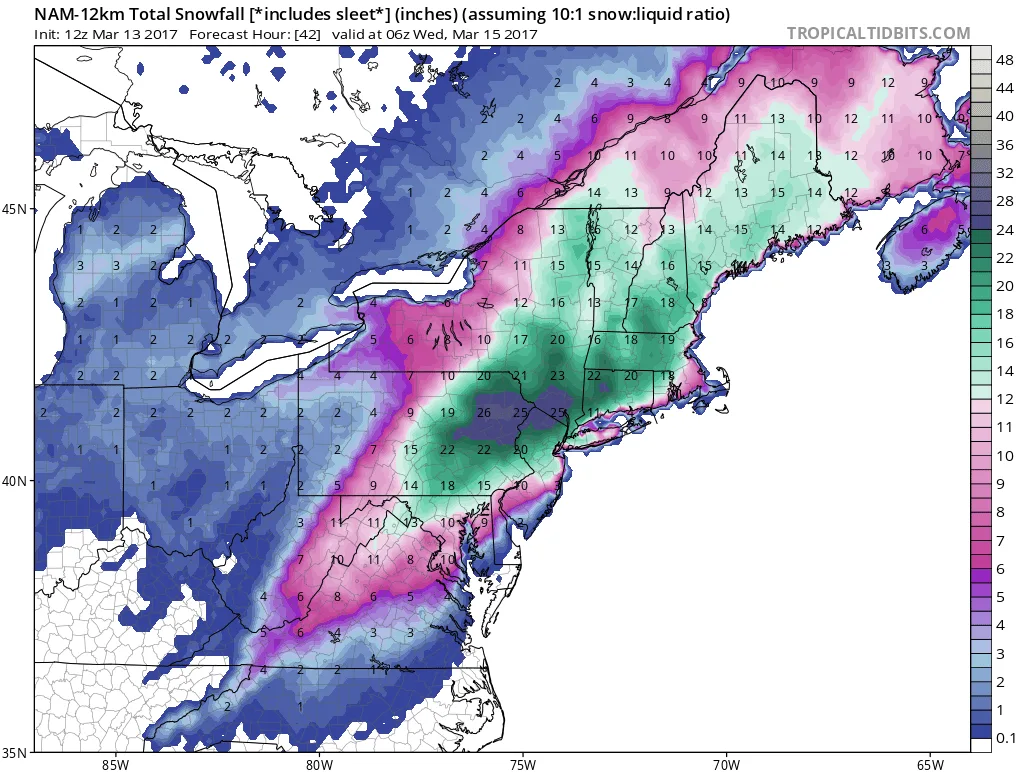
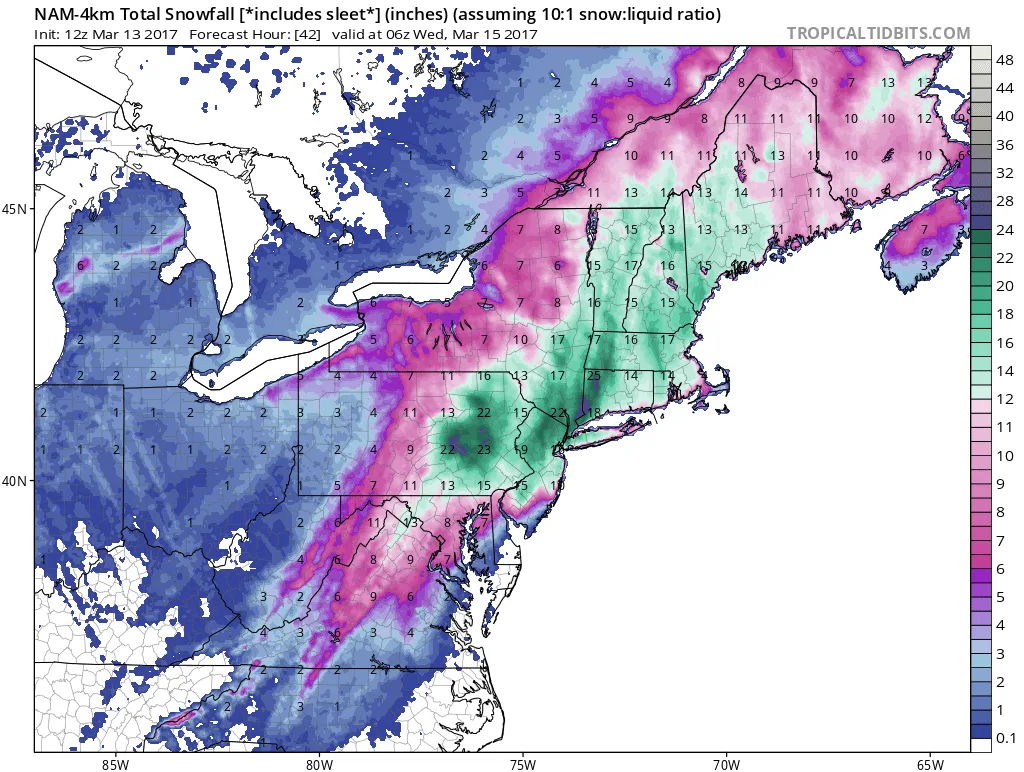
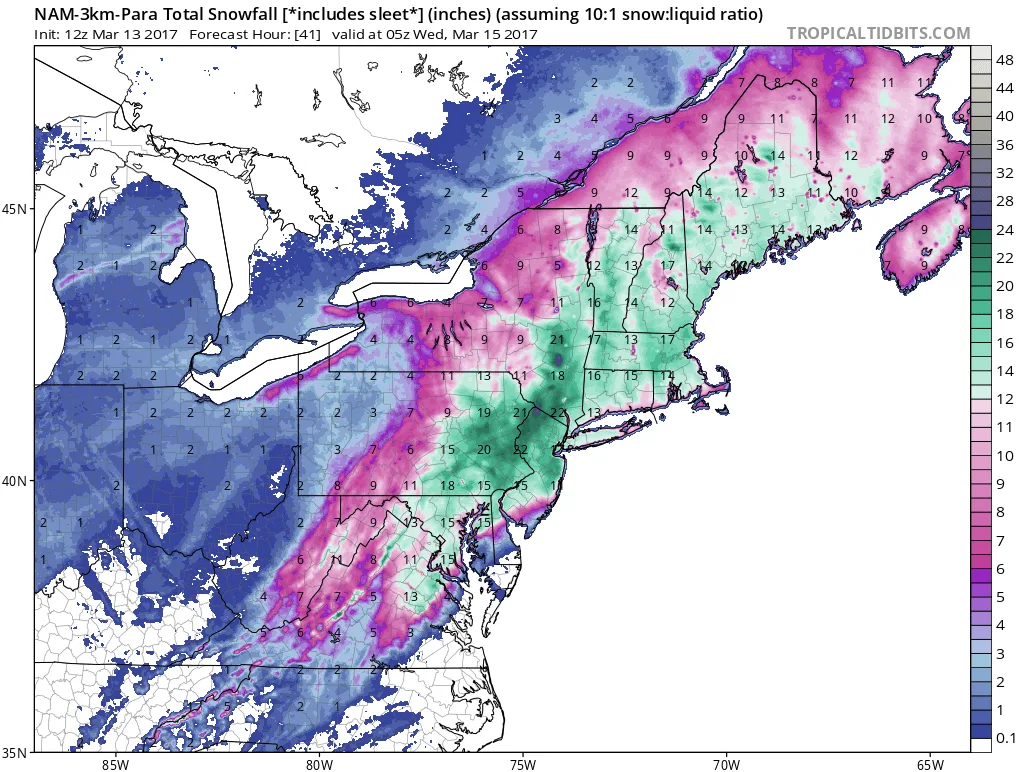
As I alluded to yesterday, this forecast is becoming VERY tricky. We’re at the point where a 25 mile shift East or West will make a significant difference in snowfall totals. At this time frame the margin of error on models can be 50-75 miles under normal circumstances. The key here is where the Rain/Snow/Sleet line sets up and the models are struggling with this forecast. Some have the warm wedge reaching no further West than the middle of Suffolk county, while other’s have the warm wedge reaching as far West as Brooklyn/Manhattan. It’s possible we may not know how far West the warm wedge reaches until the storm is well underway.
I have very low confidence in the following snowfall forecasts, and will likely have to change them several times today and possibly even adjust while the storm is ongoing:
Manhattan and Brooklyn: 14-20 inches
Queens and Nassau: 12-18 inches
Western Suffolk North of Sunrise: 10-15 inches
Eastern Suffolk: 6-12 inches
Areas South of either the Southern State or Sunrise Highway can expect lower totals. Areas to the North, especially North of the LIE can expect totals on the higher end. This is due to the Rain/Sleet line making it on shore and cutting down on totals.
Timing: Snow should start sometime around or just after Midnight tonight. Some models have the snow starting as late as 1-3am (3K NAM actually starts as late as 5am but this is probably too late). In terms of end time, this also varies widely depending on the model and the track. My best guess is somewhere between 1 and 4pm for the snow to stop.
I’m posting multiple snow total maps so you can get an idea of what we’re looking at. Keep in mind that on ALL the maps, sleet is counted as snow. So in the areas that I highlighted above that could warm, several inches can be taken off the snow totals.